3 Ways To Use Google MyMaps with Member Data
3 Ways To Use Google MyMaps with Member Data
Online mapping tools are web-based programs you can use to generate custom maps using location data. These tools are used to create a wide variety of map types, such as heat and survey maps. Many mapping programs are free or have a free trial version.
Today, we'll cover how associations can use Google MyMaps, a free mapping tool - all you need is a google account!
#1 Boost Advocacy Efforts
Congressional representatives and other elected officials want to know who your association members are and the populations they represent, because anyone over 18 is a potential voting constituent. Showing this data visually in a map can provide a powerful leave-behind piece to share with your elected officials.
#2 Gain Insights on Programming and Attendance Trends
Use layers within a map to discover how factors like programming content, date, time, and location affect member engagement. Analyzing your member data visually creates another layer of information and indicators of when, where, and how your members want to participate.
#3 Streamline Member Recruitment and Retention Efforts
A visual map allows you to not only get a general overview of member distribution, it also allows you to be strategic in your recruitment and retention efforts.
For in-person member outreach, strategically planning visits to members grouped within a specific radius makes your outreach more efficient. Who doesn’t love to save gas money and mileage costs?
It can also allow you to see areas that have the most opportunity for growth.
Case Studies
Boost Advocacy Efforts Using Location-Based Data
The Florida Apartment Association recently used member data to provide a leave-behind for legislators that included geographical member information. Their goal was to provide information about the positive impacts their industry has on the local population and area businesses.
This customer is a statewide organization that has the budget and resources for an advocacy platform designed to help with voter outreach and track legislation. If your association hasn't budgeted for this, and needs to get this information in front of your elected officials, this is where Google MyMaps comes in!
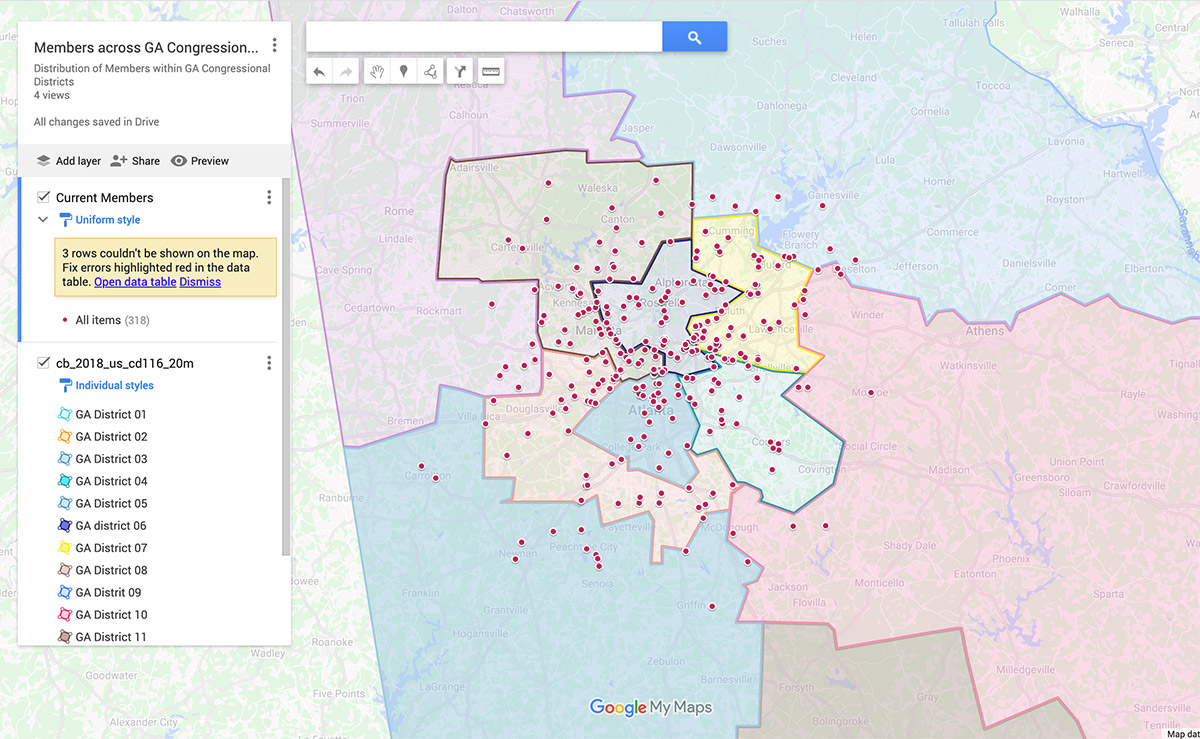
With minimal tech-savviness necessary, you can create a map that shows member distribution across congressional districts. To acomplish this, you will use Google MyMaps combined with the Census Bureau’s congressional district maps. Below is an example of a map using Georgia's congressional district data.
Step-by-step instuctions can be found here.
Combine this graphic with other numerical data so that you can provide a visual takeaway of how your members and the industry are making an impact in your elected officials' territory.
Evaluate your Meetings, Programs, and Events to Increase Participation
In my former life as an Executive Director for an association, I found that venue selection can be a determining factor in member participation. Having a bird’s eye view of your member concentration can assist in the venue selection process.
Tip: Keep a spreadsheet of venues and their addresses. That way, you can upload them as a layer in MyMaps and use it in conjunction with your member map to find centrally located venues for most members.
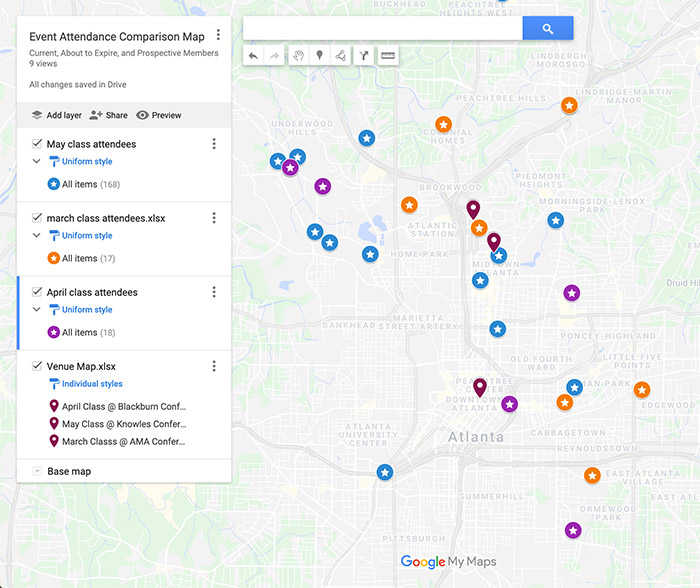
As an added bonus, you can gain insights on member participation by running event attendance reports and comparing them with your member map in MyMaps. Use historical event attendance data to plot a “heat map” of member participation for one or multiple events.
Let’s say you host monthly meetings. Pull an event attendance report in excel format after the meeting and upload it to MyMaps to see the distribution of attendees. For each event, add a layer of event attendance records and designate a specific color for each event.
Creating a map with several layers of attendees allows you to evaluate how factors like programming content, date, time, and location could affect member engagement. Depending on the amount of data you’ve collected, consider what you might learn with additional segmentation based on credentials, age, gender, and/or interests.
Evaluate the results and consider the factors involved:
- Are your events in the same location or different locations, and does attendance appear to fluctuate based on location?
- Are certain members participating during the workday versus evening events?
- Content evaluation: Did the marketing meeting get more participation from a certain area than the legislative meeting?
Having attendance trends readily available in MyMaps allows your organization to strategize where to hold future meetings, classes, or programs to boost participation.
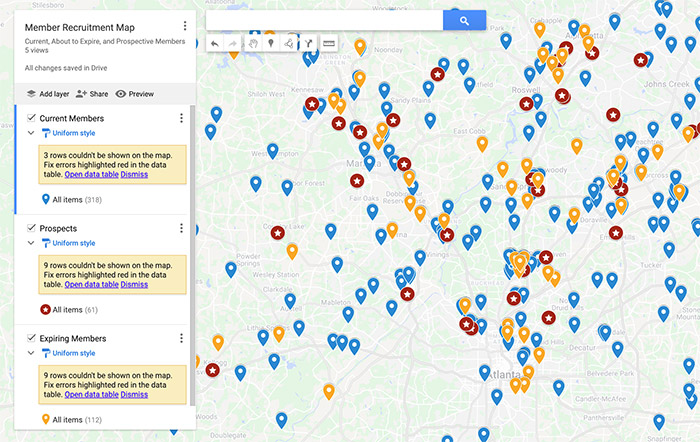
Streamline Member Recruitment and Retention
Recruitment and retention of members is crucial to any member-based organization. How can using a map enhance these efforts? Visualizing your members with MyMaps allows your organization to maximize your efforts during recruitment and retention.
The Atlanta Apartment Association, for example, has a 3-month long membership drive. Their membership committee is split into teams, and each team competes against each other during the membership drive. They get credit for each new member and renewal gained during this time (and the team with the most wins some awesome prizes at the end).
To help the teams strategically plan their visits, the Association uses member and nonmember data paired with MyMaps to drill down the list of current members and potential members across their territory. Delegating specific areas helps the committee members strategically plan their visits to members within the same geographic location. Mapping allows them to maximize their time and efficiency (and save some gas money while they’re at it – Atlanta traffic is no joke!).